


#7 Daniel Kahneman's Base Rate Fallacy and Impact of Scope 3 Emissions on ESG Performance Benchmarking
This edition dives deep into the Scope 3 emissions of primarily high ESG scoring IT companies, the impact on ESG benchmarking and industry outlook, & base rate fallacy of emissions on revenue vs cost.

Darshan Kumar, my advisor and friend who plays a crucial role in my exposure to the Indian news media sent a very interesting piece this morning, pertaining to coverage of the release of the CRISIL research report of benchmarking the ESG parameters of 225 top Indian companies across various sectors.
Although the list looks fairly straightforward, my experiences within the ESG space for the past couple of years leaned towards the voice of the monkey-brain inside my head which said there is more to this. What I uncovered is a missing link to the narrative that balances the outlook towards ESG performance benchmarking as attempted by CRISIL through the report they released yesterday, and also highlight the base rate fallacy that contributed to the omission of this critical piece.
Scope 3 Emissions - An Introduction
Having covered some of the basic definitions of GHG Emissions in Annexure - A, we take a deep dive into Scope 3 Emission, which is a critical component for the purposes of this post.
The EPA defines Scope 3 Emissions as
Scope 3 emissions are the result of activities from assets not owned or controlled by the reporting organization, but that the organization indirectly impacts in its value chain

The widely accepted outlook towards Scope 3 Emissions is that of a “Value Chain Emission”. However, an often overlooked yet critical component within its measurement and definition, based on the benchmark definition of the Scope 3 emissions by “The Corporate Value Chain (Scope 3) Accounting and Reporting Standard” — is Distribution, Storage, Use, and End-of-Life.

Bottom Line: Scope 3 is more towards the consumption side of things - Distribution, Storage, Use, and End-of-Life aspects of the product, service, or platform.
Scope 3 Emissions and Top ESG Performers based on CRISIL report
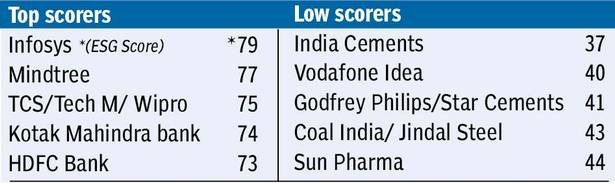
Just taking the example of the top 5 performing companies (Figure 1) in the ESG Benchmarking report by CRISIL, we find the following results in the sustainability reports of those individual companies:
MindTree: Emissions stood at 2.05 tons CO2e/employee/annum in the year 2019-20.
TCS: Limited the Scope 3 Emissions (termed “Value Chain Emissions”) to the carbon footprint of full-time employees, 60% of which was attributed to business travel.
Tech Mahindra: A fairly detailed snapshot provided for the Scope 3 emissions, however still restricted to purchased goods and services, employee commute, business travel, waste generated in operations, and fuel and energy-related activities.

Wipro: Scope 3 emissions accounted for Business Travel, Employee Commute and Upstream fuel and energy emission category for last three years. The most interesting part written in the report was the statement “– these contribute to 50% of our overall emissions”. Scope 3 contributes to half the GHG emissions by the company.
Infosys: Restricted to business travel, employee commute, transmission and distribution losses, and capital goods.
Impact of Scope 3 Emissions and Imbalance of ESG Benchmarking
A recent FT article on companies grappling with Scope 3 emissions put forth the following that articulates the problem at hand.
Measuring emissions is sometimes like measuring calories in a diet — there is a touch of art along with the science. And, for companies, it is most difficult to be purely scientific over indirect, or “Scope 3”, emissions — the greenhouse gases emitted all along their supply chains and in the use of their products.
Scope 3 emissions are typically the biggest part of a company’s carbon footprint and the hardest to measure. Yet, despite the challenges, more companies are trying to do so.
The sustained theme across the top ESG performers remain consistent on the following:
Impact of Scope 3 Emissions: Especially for asset-light companies, over 50% of the GHG emissions are attributed to Scope 3 emissions.
Restricted measurement of Scope 3 Emissions: All the companies have not included the crucial components of storage and distribution, consumption, and end-of-life emissions as a part of their sustainability disclosures.
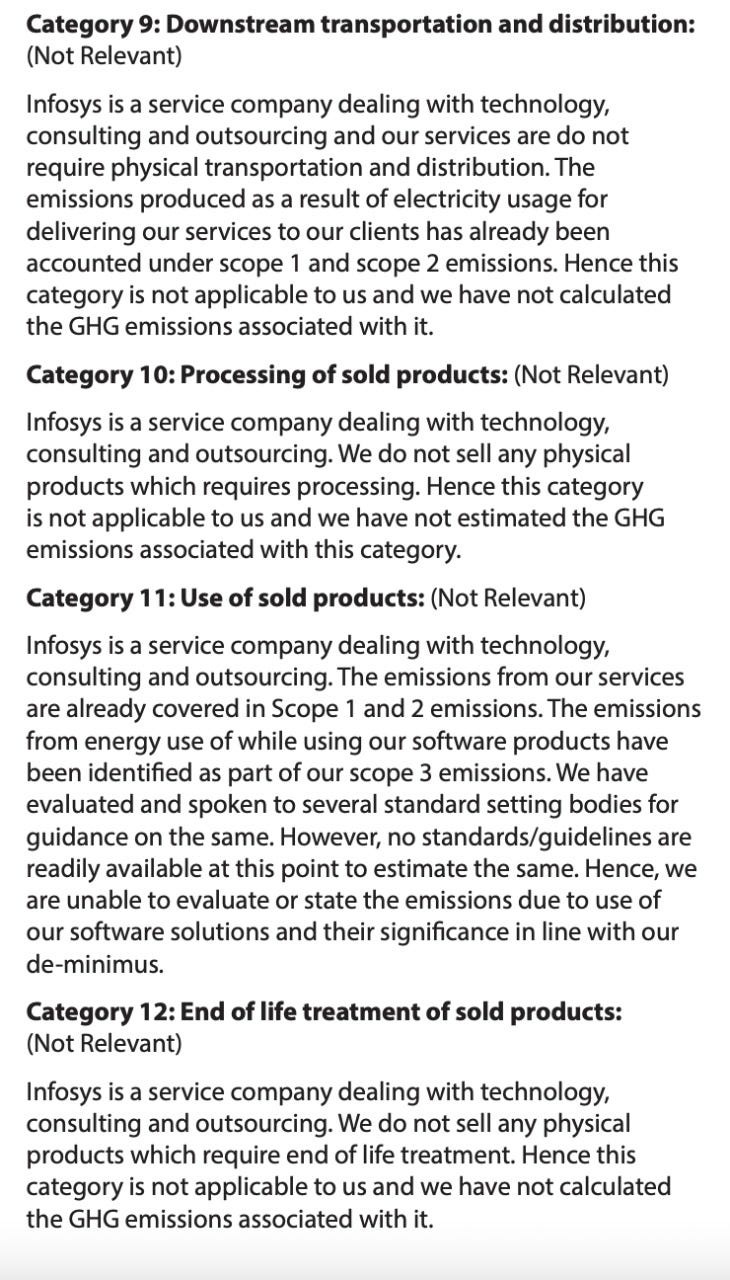
The industry-wide gap in the measurement of Scope 3: This is accurately described in the Infosys sustainability report, which talks about the void left by the absence of standards and guidelines to measure the impact of the GHG emissions by storage, distribution, consumption, and end-of-life component of IT services.
Impact on CRISIL Benchmarking: The benchmarking scores take into account the scores of the sector as a whole, as well as the company. Omitting the extent of Scope 3 emissions might lead to a definite imbalance, with our without adding any statistical control variables to the scoring index. The disclosures of Scope 3 amongst various industries varies and is huge. However, IT tops the chart, and due to an availability bias, we take it as a fact that IT companies produce less GHG emissions than others. Although true, the degree to which this is accurate however might not be close to the widely accepted perception.
The recent crash of cryptocurrency (Bitcoin amongst others) was widely circulated in the news media due to Elon Musk admitting the fact that cryptocurrency mining is an intensive process that has a large carbon footprint. Some of the other examples of initiatives quoted by industry leaders in the US are mentioned here.
The very fact that the mismatch between a Morgan Stanley post regarding Scope 3 emissions that ranks the communications industry (read telecom) slightly lower than that of information technology, and the vast difference between the “environment” parameters of IT companies in India and Idea Cellular prompted me to investigate this further.
Another interesting parameter is the fact that capital allocation for mitigation of Scope 3 emissions is significant. An interesting part of the report is also the fact that the performance of sectors w.r.t carbon emissions is calculated with the consideration of the base rate being revenue (page 42 of the report) and not cost. This skews the viewer in understanding the impact of GHG emissions from a short term perspective and not the performance in mitigating the risk of these GHG emissions through capital allocation. I believe this constitutes the “Base Rate Fallacy” as described by Daniel Kahneman and Amos Tversky. More on this in Annexure-C.
If we consider the entire range of Scope 3 emissions that could be accounted for by the IT sector (including storage, distribution, consumption, and end-of-life components), the graph in the report (page 43 of the CRISIL report) pertaining to “Carbon Emissions Multiple” will not look the same.

P.S. An interesting read towards an attempt to evaluate the carbon footprint of a software platform hosted in the cloud can be found here.
Conclusion
I believe we are taking steps in the right direction to measure GHG emissions, with industry leaders undertaking massive investments in mitigating ESG risks and create more sustainable businesses. Scope 3 emissions remain a challenge for most companies, even more so for IT companies. We must be cognizant of the Scope 3 emissions while undertaking the company-wide KPI benchmarking and take concrete steps in having a deep understanding of the value chain emissions. A good start to this will be understanding the life-cycle assessment for the company’s primary value drivers, and how best can then the capital allocation take place to mitigate the GHG emission risks.
Annexure - A: GHG Emissions, A Brief.
Explaining Scope 1, 2 & 3
To help delineate direct and indirect emission sources, improve transparency, and provide utility for different types of organizations and different types of climate policies and business goals, three “scopes” (scope 1, scope 2, and scope 3) are defined for GHG accounting and reporting purposes. Scopes 1 and 2 are carefully defined in this standard to ensure that two or more companies will not account for emissions in the same scope. This makes the scopes amenable for use in GHG programs where double counting matters. Companies shall separately account for and report on scopes 1 and 2 at a minimum.
Scope 1: Direct GHG Emissions
Direct GHG emissions occur from sources that are owned or controlled by the company, for example, emissions from combustion in owned or controlled boilers, furnaces, vehicles, etc.; emissions from chemical production in owned or controlled process equipment. Direct CO2 emissions from the combustion of biomass shall not be included in scope 1 but reported separately. GHG emissions not covered by the Kyoto Protocol, e.g. CFCs, NOx, etc. shall not be included in scope 1 but may be reported separately.
Scope 2: Electricity Indirect GHG Emissions
Scope 2 accounts for GHG emissions from the generation of purchased electricity consumed by a company. Purchased electricity is defined as electricity that is purchased or otherwise brought into the organizational boundary of the company. Scope 2 emissions physically occur at the facility where electricity is generated.
Scope 3: Other Indirect GHG Emissions
Scope 3 is an optional reporting category that allows for the treatment of all other indirect emissions. Scope 3 emissions are a consequence of the activities of the company, but occur from sources not owned or controlled by the company. Some examples of scope 3 activities are extraction and production of purchased materials; transportation of purchased fuels; and use of products and services.
Annexure B - CRISIL Benchmarking


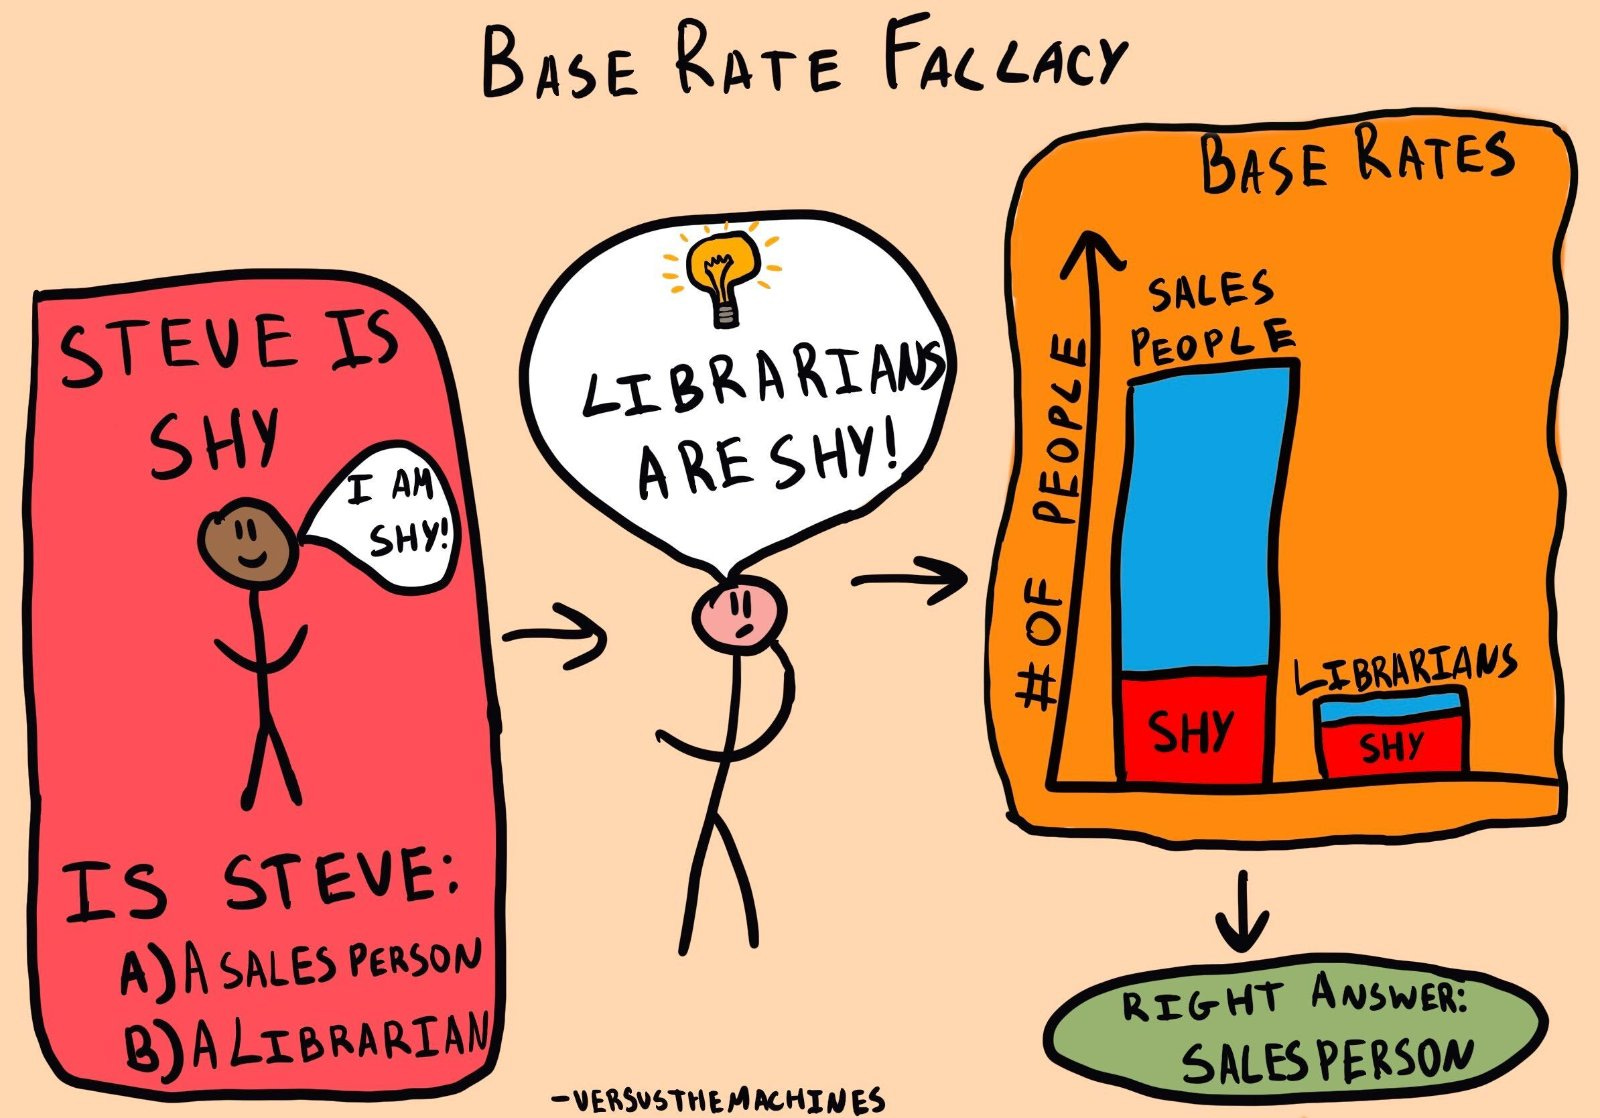
Annexure C - Base Rate Fallacy
More on this can be found on this link, as well as the seminal paper titled “Judgment Under Uncertainty: Heuristics and Biases, 1974” that can be found here. Another interesting video showcasing the same can be found here.
No head for numbers: why we struggle to understand statistics and make avoidable mistakes because of it.
How can you make predictions on whether certain things will happen?
One effective way is to keep the base rate in mind. This refers to a statistical base, which other statistics rely on. For example, imagine a large taxi company has 20 per cent yellow cabs and 80 per cent red cabs. That means the base rate for yellow taxi cabs is 20 per cent and the base rate for red cabs is 80 per cent. If you order a cab and want to guess its colour, remember the base rates and you will make a fairly accurate prediction.
We should therefore always remember the base rate when predicting an event, but unfortunately, this doesn’t happen. In fact, base-rate neglect is extremely common.
One of the reasons we find ourselves ignoring the base rate is that we focus on what we expect rather than what is most likely. For example, imagine those cabs again: If you were to see five red cabs pass by, you’d probably start to feel it’s quite likely that the next one will be yellow for a change. But no matter how many cabs of either colour go by, the probability that the next cab will be red will still be around 80 per cent – and if we remember the base rate we should realize this. But instead, we tend to focus on what we expect to see, a yellow cab, and so we will likely be wrong.
Base-rate neglect is a common mistake connected with the wider problem of working with statistics. We also struggle to remember that everything regresses to the mean. This is the acknowledgement that all situations have their average status, and variations from that average will eventually tilt back toward the average.
For example, if a football striker who averages five goals per month scores ten goals in September, her coach will be ecstatic; but if she then goes on to score around five goals per month for the rest of the year, her coach will probably criticize her for not continuing her “hot streak." The striker wouldn’t deserve this criticism, though, because she is only regressing to the mean!